Circular Progression Bar - Customise and Save Colour Preferences (Part 2)
- vikashsingh01
- Mar 12, 2024
- 6 min read
Updated: Jul 19, 2024
So, my first post was so good that you decided to come back for Part 2, eh? What do you mean that you randomly came across my post and have no idea who I am?! Well that also makes sense... Let's begin!
This is a follow-up to my Part 1 post in which I show you how to create a circular progression bar in Canvas Apps. You don't need to have read and followed along with the whole of Part 1 in order get value out of this post. In fact, you can follow this post even if you haven't read Part 1 at all!
This is where we will end up:
Add the following code to your OnStart:
ClearCollect(
colColours,
Table(
{
Name: "Black",
Colour: RGBA(0,0,0,1),
Code: "RGBA(0,0,0,1)"
},
{
Name: "Grey",
Colour: RGBA(153, 153, 153, 1),
Code: "RGBA(153, 153, 153, 1)"
},
{
Name: "White",
Colour: RGBA(255,255,255,1),
Code: "RGBA(255,255,255,1)"
},
{
Name: "Naples Yellow",
Colour: RGBA(244, 211, 94, 1),
Code: "RGBA(244, 211, 94, 1)"
},
{
Name: "Azure Blue",
Colour: RGBA(53, 125, 237, 1),
Code: "RGBA(53, 125, 237, 1)"
},
{
Name: "Forest Green",
Colour: RGBA(36, 130, 50, 1),
Code: "RGBA(36, 130, 50, 1)"
},
{
Name: "Iris Purple",
Colour: RGBA(97, 61, 193, 1),
Code: "RGBA(97, 61, 193, 1)"
},
{
Name: "Pumpkin Orange",
Colour: RGBA(240, 128, 60, 1),
Code: "RGBA(240, 128, 60, 1)"
},
{
Name: "Cerise Red",
Colour: RGBA(216, 49, 91, 1),
Code: "RGBA(216, 49, 91, 1)"
},
{
Name: "Bright Pink",
Colour: RGBA(236, 87, 102, 1),
Code: "RGBA(236, 87, 102, 1)"
}
)
);You can swap these out and have as many or as few colours as you like. You might want to add the branding colours of your company to this Collection, or simply just pick colours you like.
Run the OnStart and highlight colColours to make sure it has loaded in properly:

Add these 6 controls onto the screen:
2x Drop downs
2x Rectangles
2x Labels
And rename them so it looks like this:

For both Dropdown1 and Dropdown2, set the
Items property to colColours
Value property to Name:

Set the Fill property of Colour1 to:
LookUp(colColours, Name = Dropdown1.Selected.Name).ColourSet the Fill property of Colour2 to:
LookUp(colColours, Name = Dropdown2.Selected.Name).ColourSet the Text property of RGBA1 to:
LookUp(colColours, Name = Dropdown1.Selected.Name).CodeSet the Text property of RGBA2 to:
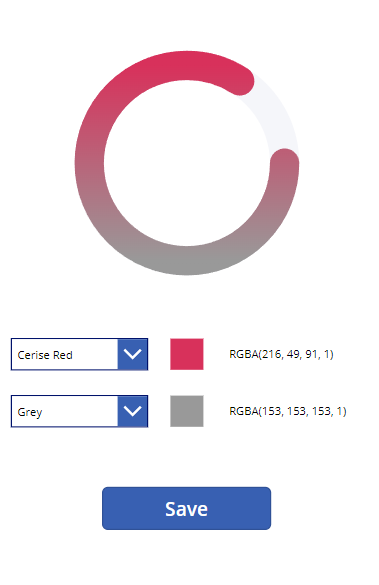
LookUp(colColours, Name = Dropdown2.Selected.Name).CodeAt this point, when you change the values in the dropdowns you should see that the colour and RGBA code change with it:


Now it’s time to allow these selections to affect our circular progression bar. Add an Image control to the screen and copy the following code into your Image control's Image property - thanks Microsoft, not at all confusing. No, seriously who thought this was a good idea?! Ahem, as I was saying:
"data:image/svg+xml;utf8, " & EncodeUrl("


<svg viewBox='0 0 100 100' xmlns='http://www.w3.org/2000/svg'>


<defs>
    <linearGradient id='gradient' x1='0%' y1='0%' x2='0%' y2='100%'>
      <stop offset='0%' style='stop-color:"& RGBA1.Text &"; stop-opacity: 1' />
      <stop offset='100%' style='stop-color:"& RGBA2.Text &"; stop-opacity: 1' />
    </linearGradient>
</defs>


    <circle cx='50' cy='50' r='40' stroke='rgba(245,246,250,1)' stroke-width='12' fill='rgba(0,0,0,0)'/>
    <circle cx='50' cy='50' r='40' stroke='url(#gradient)' stroke-linecap='round' stroke-width='12' fill='rgba(0,0,0,0)' stroke-dasharray='251' stroke-dashoffset='" & varDashoffset & "'/>


</svg>


")
You’ll notice how for the stop-color attribute we are just passing in the Text values of the two RGBA labels. It looks like this:
How do I save this information so the app remembers a user's colour preferences?
You can save data to a data source via two methods in Canvas Apps: The Form control or the Patch function. I prefer to use Patch so that's the method of choice here. We need to know 2 things before we begin:
Where we will save this information - i.e. a Dataverse table, SharePoint list etc.
What fields (also known as columns) we will use to store this information
Naturally, I can't demonstrate this for every kind of data source out there. If I did, Microsoft would rebrand Power Pages at least four times by the time you finished reading this post. However, you should be able to easily adapt it to your scenario and data source of choice.
For this example, I have a custom Dataverse table called Employees with two Text fields called Colour 1 and Colour 2. Let’s add our Employees Dataverse table to our app:

Now we’ll need to add a Button control to the screen which will allow us to save the colours:
In the OnSelect of the Button, copy the following code:
//Saving our changes to our data source
Patch(Employees, LookUp(Employees, Email = User().Email), {
    'Colour 1': RGBA1.Text,
    'Colour 2': RGBA2.Text
});


//Saving our changes locally
Set(varLoggedUserCol1, RGBA1.Text);
Set(varLoggedUserCol2, RGBA2.Text);
This will make sure we are saving it back to the data source as well as locally so the user can see the changes without having to reload the app. Remember, the above is only example code and you would need to change the Table and field names (in this case, Employees and Colour 1/Colour 2) to match your case appropriately.
We can then store the logged-in user’s colour preference in the OnStart using:
Set(varLoggedUserCol1, LookUp(Employees, Email = User().Email).'Colour 1');
Set(varLoggedUserCol2, LookUp(Employees, Email = User().Email).'Colour 2');
With the code in place, replace the code in your Image control's Image property to:
"data:image/svg+xml;utf8, " & EncodeUrl("

<svg viewBox='0 0 100 100' xmlns='http://www.w3.org/2000/svg'>

<defs>
    <linearGradient id='gradient' x1='0%' y1='0%' x2='0%' y2='100%'>
      <stop offset='0%' style='stop-color:"& RGBA1.Text &"; stop-opacity: 1' />
      <stop offset='100%' style='stop-color:"& RGBA2.Text &"; stop-opacity: 1' />
    </linearGradient>
</defs>

    <circle cx='50' cy='50' r='40' stroke='rgba(245,246,250,1)' stroke-width='12' fill='rgba(0,0,0,0)'/>
    <circle cx='50' cy='50' r='40' stroke='url(#gradient)' stroke-linecap='round' stroke-width='12' fill='rgba(0,0,0,0)' stroke-dasharray='251'/>

</svg>

")

//We have REMOVED stroke-dashoffset attribute so we can get a full circle - we don't need to see progress here as we are customising the colours
//We are plugging in the Text values of the Labels (RGBA1 and RGBA2) to allow us to see how the dropdowns change the circle
And now on other screen(s) where you need actually display the SVG in your app use the following code:
"data:image/svg+xml;utf8, " & EncodeUrl("

<svg viewBox='0 0 100 100' xmlns='http://www.w3.org/2000/svg'>

<defs>
    <linearGradient id='gradient' x1='0%' y1='0%' x2='0%' y2='100%'>
      <stop offset='0%' style='stop-color:"& varLoggedUserCol1 &"; stop-opacity: 1' />
      <stop offset='100%' style='stop-color:"& varLoggedUserCol2 &"; stop-opacity: 1' />
    </linearGradient>
</defs>

    <circle cx='50' cy='50' r='40' stroke='rgba(245,246,250,1)' stroke-width='12' fill='rgba(0,0,0,0)'/>
    <circle cx='50' cy='50' r='40' stroke='url(#gradient)' stroke-linecap='round' stroke-width='12' fill='rgba(0,0,0,0)' stroke-dasharray='251' stroke-dashoffset='" & varDashoffset & "'/>

</svg>

")

//We are keeping the stroke-dashoffset attribute as that allows us see the progress
//We are plugging in the varLoggedUserCol1 and varLoggedUserCol2 for our colours
//These are also in the OnStart so they will load when the app first launches as well as when we change it via the Customisation Screen
That may sound a little complicated, but the overall experience would look a little something like this (to get higher video quality, open the video up in YouTube by clicking the YouTube icon):
Pretty neat, right? However, before you try to implement this into an enterprise or business process Canvas App, I want you to ask yourself one question:
“How important is customisation for my end users?”
There are some reasons for this:
⌚ This feature could be something which ends up costing an organisation a lot of time. If an app first launches with this feature into an organisation of 100 employees and they all spend about 2 minutes choosing what colours they like the most, that has cost the company 100 x 2 = 200 minutes, not ideal…
🔨 If something goes wrong with implementation somewhere down the line, this will require time to fix, test and redeploy.
📦 This is all data which needs to be stored somewhere and then loaded into the app. This means extra fields, more data in your table, and performance will decrease slightly due to the fact we have to load this extra data in the OnStart.
Although one could argue these points can be applicable to just about anything, as developers and consultants we should carefully consider the features we add to our apps and how much value they are bringing. Some instances of when a feature like this would be appropriate to implement are:
If customisation is highly valued by yourself
If customisation is highly valued by the client/organisation you are implementing this for
You are creating an app for end users with accessibility issues
If you find any errors or issues either with the code itself or the instructions I have provided, please let me know! Either leave a comment or feel free to message me on LinkedIn - your contributions will help to make these posts better and improve readability for future readers.

Comments